
This guide explains the main areas of the Takooni dashboard and how to interpret the information presented on each page. If you are looking for an explanation of specific Takooni features and how they work, we recommend reading Takooni Features first.
Main Dashboard
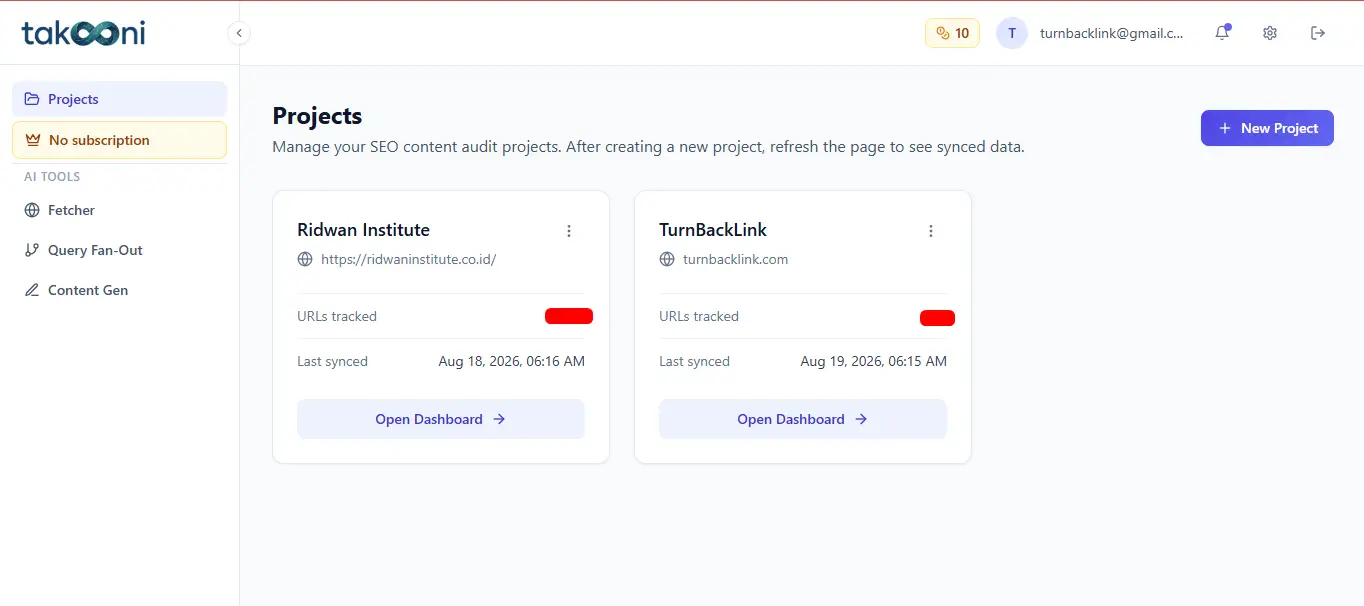
When you first access Takooni, the main dashboard displays the projects you have previously registered. If you do not see any projects, you need to add a website before you can access its performance data.
See How to Add a Website to Takooni for step-by-step instructions.
1. Projects
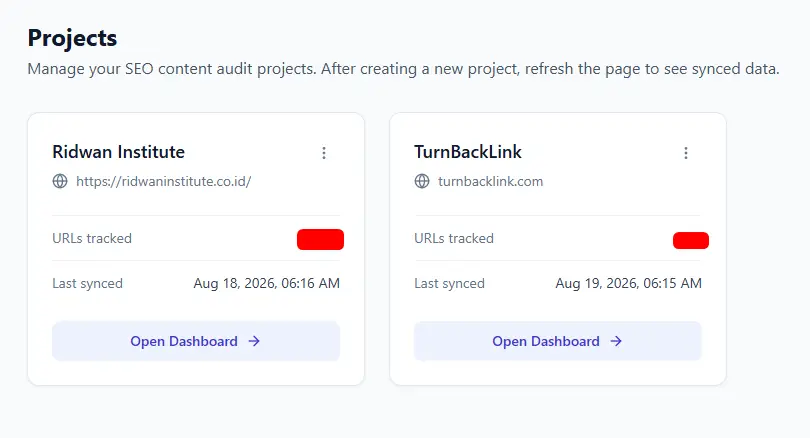
The main dashboard displays all websites or projects currently registered in your Takooni account.
The number of projects you can create and monitor depends on your current subscription plan. Select a project to access its SEO performance data, content audit, and other available analysis features.
2. Takooni Credits

Takooni uses a credit-based system for certain analysis and AI-powered features. Credits are consumed when you perform activities that require additional processing or AI analysis.
Depending on the feature, credit usage may include:
- User Intent Analysis — Analyzes the search intent associated with queries for which your content is indexed.
- Query Positioning & Clustering — Analyzes query positions and groups related search queries to help you understand your search visibility.
- URL Fetch — Performs AI crawling tests to determine whether your URLs and content can be accessed by supported AI bots and search engine crawlers.
- Query Fan Out — Generates related search queries and topic opportunities to support your SEO and content strategy.
- Content Generation — Uses AI to help produce content designed to support your organic search performance.
⚠️ Important: Credit consumption varies by feature. Always review the credit requirement displayed before running an analysis or AI-powered operation.
When your available credits are depleted, credit-based features will no longer be available until additional credits are added to your account.
See How to Top Up Takooni Credits for more information.
Project Dashboard
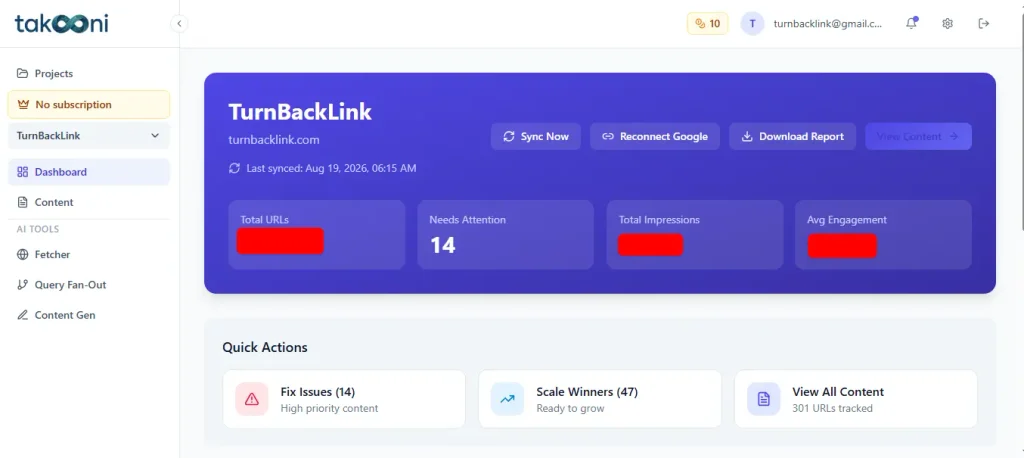
After selecting a project, Takooni displays an overview of the website’s SEO performance. The project dashboard provides a high-level view of the following information:
- Website — The website currently being monitored.
- Synchronization Status — Indicates whether your project data is synchronized and available for analysis.
- Total URLs — The number of URLs discovered and processed by Takooni’s crawler.
- Issues — SEO and content issues identified by Takooni that may require your attention.
- Total Impressions — The total number of search impressions generated by the monitored website.
- Average Engagement Score — The average engagement score calculated from the available performance data for the project.
These metrics provide a quick overview of your website’s current performance and help you identify areas that may require further investigation.
⚠️ Important: If some metrics are empty or unavailable after synchronization, try running synchronization again and allow the process to complete or wait until 24 Hour.
For websites with fewer than 10,000 URLs, synchronization typically takes approximately 10 seconds or less. Larger websites may require significantly more processing time and, in some cases, up to 24 hours.
If the data remains unavailable after synchronization is complete, verify your internet connection and confirm that Takooni still has the required access to your Google Search Console and Google Analytics accounts.
Content Audit Dashboard
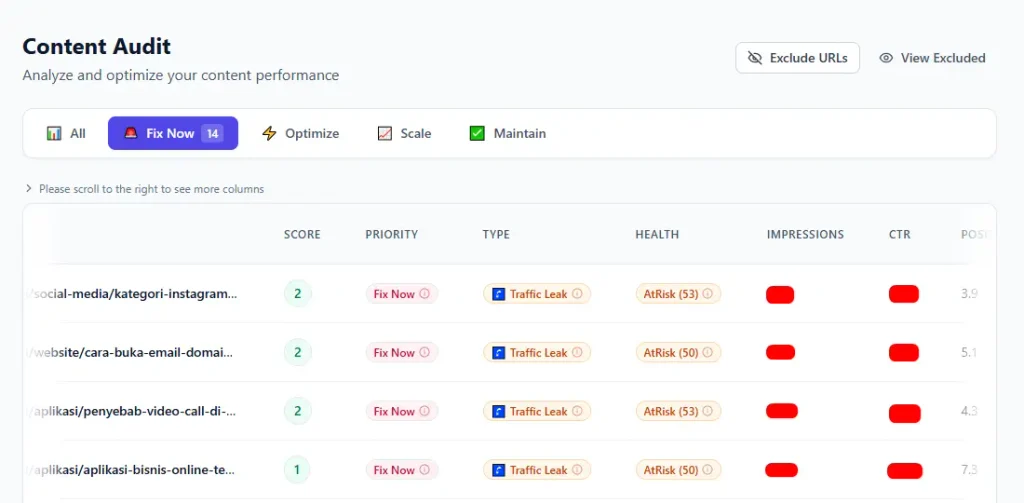
The Content Audit dashboard provides a URL-level view of your website’s organic search performance.
Each URL that has been discovered by Takooni and has relevant search visibility data can be evaluated using multiple performance metrics, including:
- Impressions — The number of times a URL appeared in search results.
- Click-Through Rate (CTR) — The percentage of impressions that resulted in clicks.
- Query Position — The URL’s position in search results for relevant queries.
- Sessions — The number of sessions generated by the content.
- Organic Traffic — Traffic attributed to organic search.
- Engagement Rate — The percentage of sessions that meet the defined engagement criteria.
- Average Engagement Duration — The average amount of time users remain engaged with the content.
- Number of Queries — The number of search queries associated with the URL.
These metrics allow you to evaluate content performance from multiple perspectives rather than relying on a single SEO metric.
1. Content Audit Status

The Content Audit Status helps you determine which URLs should receive attention first.
Takooni evaluates available performance signals and assigns each URL a status based on the Priority Focus framework.
The status is intended to help you distinguish between content that requires immediate attention, content with optimization opportunities, content that can be scaled, and content that should primarily be maintained.
See Priority Focus Statuses in Takooni for a detailed explanation of each status.
2. Include or Exclude URLs from Monitoring
The Content Audit allows you to control which URLs are included in your active monitoring workflow.
This can be useful when your website contains pages that are not relevant to your SEO analysis, such as utility pages, internal pages, test URLs, or other content that you do not want to include in your monitoring scope.
3. Excluding URLs
To exclude one or more URLs:
- Select Exclude.
- Takooni will display a checkbox next to each URL.
- Select the URLs you do not want to actively monitor.
- Select Done to apply your changes.
Excluded URLs are removed from your active monitoring view but are not permanently deleted from Takooni.
To review previously excluded URLs, select View Exclude.
⚠️ Note: Excluding a URL only changes its monitoring scope. It does not remove the URL from your website or from your source data.
URL Performance Details
Selecting a URL from the Content Audit list opens its detailed performance view.
This page provides a deeper analysis of the selected URL, combining performance metrics, search behavior, content analysis, and Takooni’s AI-generated recommendations.
The detailed view includes the following sections.
1. Content Issue
The Content Issue section identifies potential problems affecting the performance of the selected URL.
Takooni analyzes available SEO and content signals to help identify issues such as search-intent misalignment, insufficient organic visibility, or other performance patterns that may require attention.
Use this section as the starting point for understanding what may be preventing the content from reaching its expected performance.
2. Expert Insight
Expert Insight provides additional context based on the performance patterns detected by Takooni.
This section translates the available data into practical observations, helping you understand the likely significance of the identified issue rather than requiring you to interpret every metric independently.
The goal is to provide additional context for decision-making, not to replace your own SEO judgment or business context.
3. Recommended Action
The Recommended Action section provides suggested next steps based on the issues and performance signals identified for the URL.
Recommendations may include content optimization, search-intent alignment, query expansion, technical investigation, or other actions depending on the URL’s current performance.
Use these recommendations as a starting point when defining your optimization workflow.
4. Current Performance
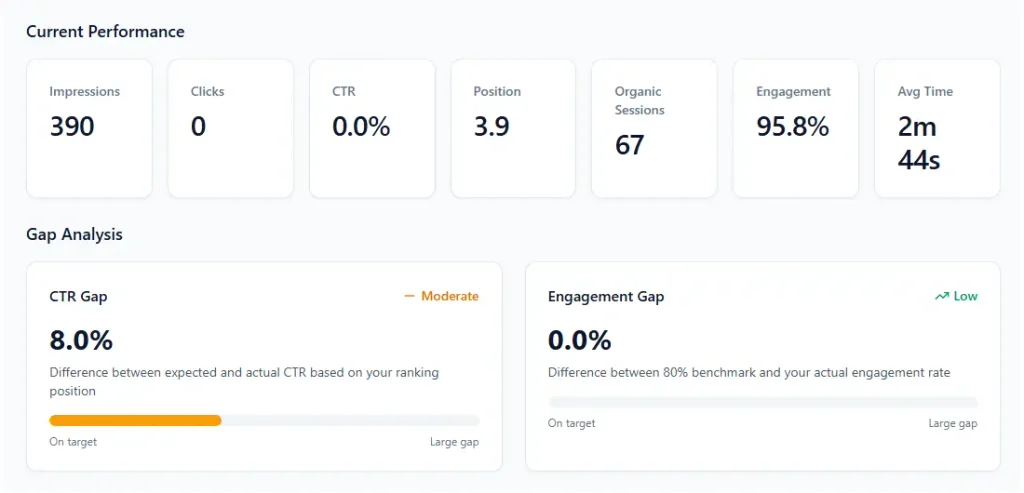
The Current Performance section summarizes the URL’s existing performance across key SEO and engagement metrics.
This provides the baseline needed to understand how the content is performing before making optimization decisions.
Depending on the available data, performance may include:
- Impressions
- CTR
- Search position
- Sessions
- Organic traffic
- Engagement rate
- Average engagement duration
- Number of queries
5. Gap Analysis
Gap Analysis helps identify the difference between the URL’s current performance and the opportunity indicated by its available search and engagement data.
By examining these gaps, you can identify areas where the content may have unrealized potential—for example, when a page receives strong impressions but relatively few clicks, or when it attracts relevant queries but does not generate sufficient organic traffic.
This section is intended to help you move from “what is happening?” to “where is the opportunity?”
6. Search Intent Distribution

The Search Intent Distribution section shows how the queries associated with a URL are distributed across different search-intent categories.
Understanding intent distribution can help you determine whether your content is primarily being discovered for informational, navigational, commercial, transactional, or other types of search behavior.
This is particularly useful when evaluating whether the content’s purpose aligns with the queries through which users discover it.
7. Keyword Positioning
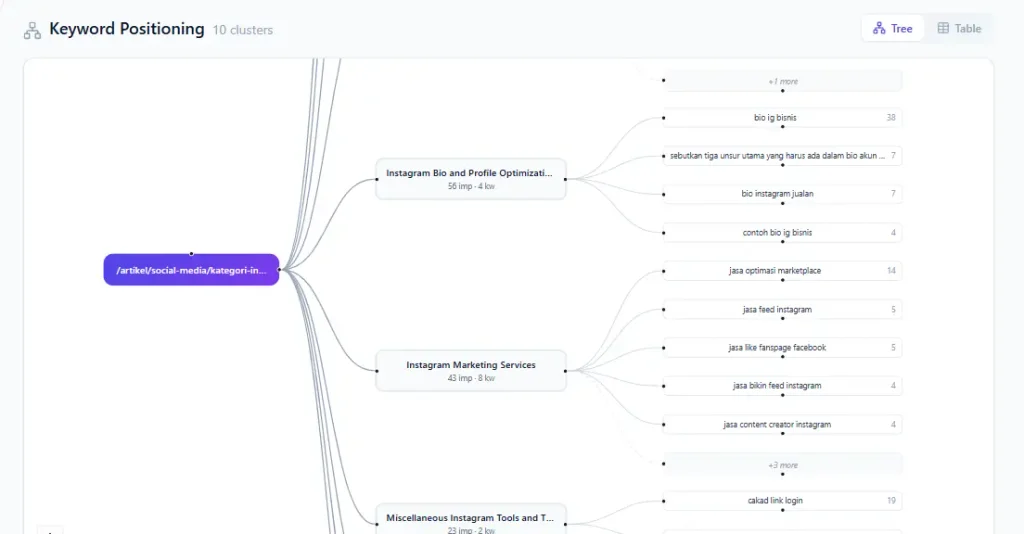
The Keyword Positioning section provides an overview of how the URL performs across the search queries associated with it.
You can use this information to identify:
- Queries where the URL already has strong visibility.
- Queries where the URL is close to reaching a higher SERP position.
- Queries where the content has visibility but requires further optimization.
- Query groups that may represent additional content opportunities.
This analysis can help you determine which keywords should be prioritized during content optimization. We also provide 2 type of keyword positioning visual to help you get better understanding, tree graph view and table views.
8. Daily Trend
The Daily Trend section visualizes the URL’s performance over time.
Use this view to identify changes in visibility, traffic, engagement, and other available performance signals.
Daily trends can be particularly useful for determining whether a change in performance is temporary or part of a longer-term pattern.
For example, a sustained decline in impressions or organic traffic may indicate that further investigation is required, while a consistent upward trend may indicate that recent optimization efforts are having a positive impact.
How to Using the Dashboard Effectively
The Takooni dashboard is designed to help you move from data collection to prioritization and action.
A recommended workflow is:
- Start with the Project Dashboard to understand your website’s overall performance.
- Review Content Audit to identify URLs that require attention.
- Use Content Audit Status to determine which URLs should be prioritized.
- Open individual URLs to review their Content Issue and Expert Insight.
- Use Gap Analysis, Search Intent Distribution, and Keyword Positioning to understand the underlying opportunity.
- Follow the Recommended Action to define your next optimization step.
- Monitor the Daily Trend to evaluate how performance changes over time.
This workflow allows you to use Takooni not only as a reporting tool, but as a decision-support system for ongoing SEO optimization.